10112016 October 11, 2016
Posted by easterntiger in economic history, economy, financial, markets, stocks.Tags: bonds, central banks, Economic Cycles, Economic History, economic theory, f fund, Federal Reserve, Financial Trends, interest rates, Markets, momentum indicator, S&P 100, S&P 500, stock market index
add a comment
Current Positions (No Changes)
I(Intl) – exit; S(Small Cap) – exit; C(S&P) –exit
F(bonds) – up to 75%; G (money market) – remainder
======================================================
Weekly Momentum Indicator (WMI) last 4 weeks, thru 10/11/16
(S&P100 compared to exactly 3 weeks before***)
-5.35, +19.83, +8.88, -5.06
Some markets are designed to test the patience and limits of investors, with no gains, no losses, and more guessing and wondering.
For 14 weeks, since the date of the last report, dozens of markets worldwide have moved only slightly from their previous levels.
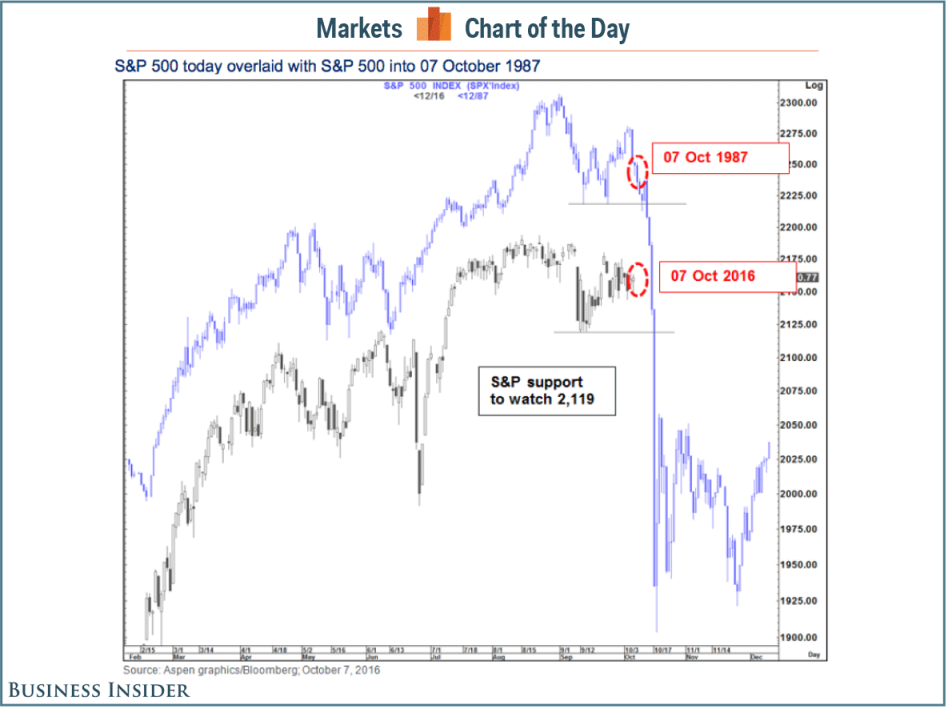
Tom Fitzpatrick is a top strategist at Citi and studies charts of trading patterns to forecast changes in the stock market.
When he and his team overlaid the current chart of the benchmark S&P 500 with the index in 1987 — right before the crash — they got “the chills.”
- There’s heightened concern about Europe and its banks. The UK has set a March 2017 date for when it will begin legal proceedings to exit the European Union, and Deutsche Bank failed to reach a swift deal that would lower its $14 billion fine with US authorities.
- We’re in “the most polarizing US presidential election in modern times.”
- More reports are circulating about central banks in Japan and Europe removing some of the economic stimulus they’ve provided by tapering their bond purchases. This is raising concerns about the efficacy of central bank policy around the world, Fitzpatrick said.
- And finally, some peculiar market moves: a 16% move in oil prices within a week; a 20-basis-point shift in US 10-year yields in five days; and a $90 move in gold prices in nine days. The Chinese yuan and British pound have made massive moves in a short period of time, too.
The MSCI World Index is a broad global equity benchmark that represents large and mid-cap equity performance across 23 developed markets countries. It covers approximately 85% of the free float-adjusted market capitalization in each country. This single index covers issues in the following countries: United States, Canada, Austria, Belgium, Denmark, Finland, France, Germany, Ireland, Israel, Italy, Netherlands, Norway, Portugal, Spain, Sweden, Switzerland, United Kingdom, Australia, Hong Kong, Japan, New Zealand, and Singapore.
On July 18, the last Weather Report date, the MSCI World Index was at 1703.93. It closed on 10/10 at 1715.22, for a net change in nearly 3 months of 0.066%.
The dependence on Fed announcements, meetings, expectations, press events has become extreme. This ‘screams’ to the absence of a market actually moving on fundamentals of either good or bad data. Good data encourages. Bad data implicates more Fed action and dependence. This is the ‘no-win/no-loss’ short-term cycle, waiting on some major, unexpected event to finally ‘pop’ the complacency; the bubble.
Over the past several months the markets have consistently drifted from one Fed or Central Bank meeting to the next. Yet, with each meeting, the questions of stronger economic growth, rate hikes, and financial stability are passed off until the next meeting. So, we wait….until the next meeting…..and the next meeting…..and the next meeting.
Business channels are already starting their ‘countdown clocks’, now at 22 days, for the next meeting. BIG YAWN!
Equity Markets – Long Term
The chart below shows the historic ‘topping’ patterns now in place. What has in the past been a 1-2 year process of ‘topping’, followed by a severe correction, is now a 2-3(?) year process. The lack of a downdraft, if you ignore the 8-10% pullbacks on October of ‘14, August ‘15, and January ‘16, have created a sense of calm by many who perceive little risk. Nothing could be further from the truth. In each case, upside has still been limited to a level that is far smaller than the travel downward. These are tests. Those who fall asleep fully invested will find themselves rushing for the door a few days too late.
S&P500 July 18th: 2166.89; October 10th: 2163.66; Net Change:-3.23
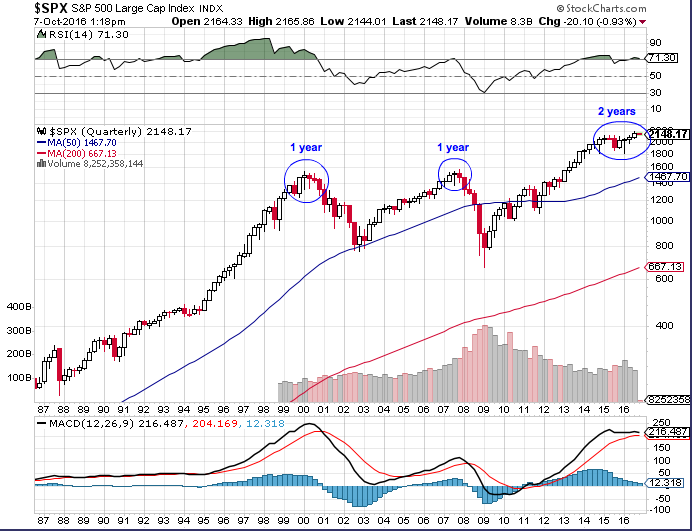 (We’ve been in this circle on the right for TWO YEARS!!)
In normal times, the S&P 500 Index should compound at 5.7% real return; so, the past five years have delivered roughly double what is normal. Getting double what you deserve (in isolation) should always make you nervous. Deceptively, these returns have only happened because of the combination of FED intervention, increasing margin debt, and stock buybacks, or, in summary, historic levels of financial engineering and borrowed money, from individuals, companies, and central banks. This money must be repaid.
Market Fundamentals/Economy

(***click chart for better view, press back button to return***)
Something smells funny.
That smell is what we call price/earnings (P/E) ratio multiple expansion. Rather than waiting for actual growth in earnings, the marketplace, over the past five years, has simply decided to pay more for earnings. Paying more for the same dollar of earnings is rarely wise and often foolish.
The chart below covers stock price to earnings ratios over the past 75 years. One thing is clear; bull markets neither sustain themselves nor continue from these levels.
When you hear that ‘stocks are cheaper than they’ve been in 10 years’, keep this picture below in mind. It most certainly is not true.
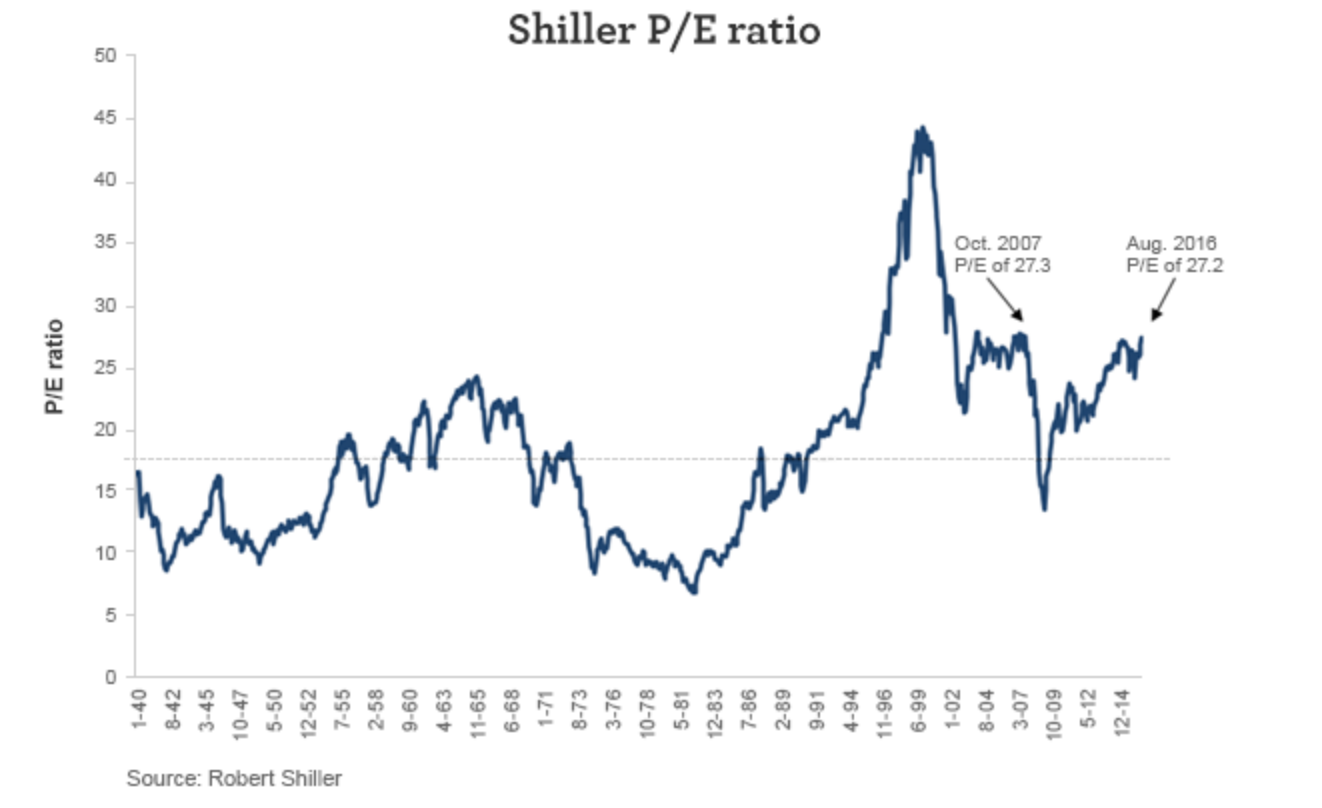
We’ve returned, once again, to the most expensive market levels in several generations. Markets are within a fraction of the valuations last seen before the last peak in late 2007. Even if some are willing, for no good reason, to chase prices higher, it doesn’t mean that they won’t be left holding the bag by those who choose not to do so.
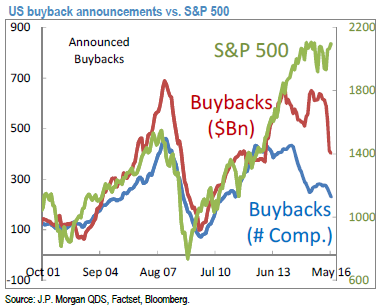
The latest data from FactSet shows that S&P 500 companies spent $125.1 billion on share buybacks during the second quarter of 2016, the lowest figure in nearly three years:

Share buybacks have been one of the biggest drivers of US equity markets since the end of the financial crisis.
Between 2012 and 2015, US companies bought $1.7 trillion of their own stock, according to Goldman Sachs. Without these big purchases, US equity flows would have actually been negative by over $1 trillion during that period. Low interest rates have encouraged companies to take on debt, and much of it was used to buy back shares rather than investing in their underlying businesses.
Whether the latest cooling in share buybacks will continue or the larger trend will resume is unclear. If it’s the latter, I’d expect equity market volatility to increase in coming quarters.
Shorter term, the stock market appears to be stuck in neutral since July-August and the trading range is narrowing. Some indexes show a coiling in a sideways triangle pattern, which says we’re going to get a strong move soon.
The month-to-month indecision shows a conflict between obvious central bank purchases for temporary support, and the reality of declining earnings, decreases in major asset purchases by the Fed (ended Oct. ’14), European Central Bank (ending in Mar. ’17), and the Bank of Japan. (decreases not yet announced, but, expected)
Overall, more than $20 TRILLION dollars worldwide have created artificial buoyancy to world markets in the past 7 years. It can’t go on forever, because the pace, methods and impact of ‘unwinding’ are not predictable.
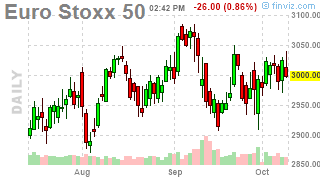
These charts show different levels of resistance for different reasons. Primarily, trend lines for each chart extend back into last year, and possibly before.
EuroStoxx 50 July 18th: 2949.17; October 10th: 3035.76; Net Change: +86.59
Nikkei 225 July 19th: 16723.31; October 10th: 16860; Net Change:+136.78

DJIA July 18th: 18533; October 10th: 18329; Net Change:-204
– Dow Industrials – resistance at 18531, reflecting the May 2015 high.

S&P500 July 18th: 2166.89; October 10th: 2163.66; Net Change:-3.23
– S&P500 – support at the May 2015 high of 2134, but, resistance at this year’s high of 2188

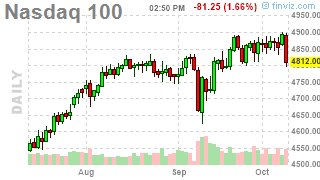
Nasdaq 100 July 18th: 4619.78; October 10th: 4893.77; Net Change:+273.99
– Nasdaq 100 – resistance at 4887, stretching back to a line drawn from July & November 2015 highs
Russell 2000 July 18th: 1208; October 10th: 1251; Net Change:+43
– Russell 2000 – resistance between 1264 and 1294, against a rising trend line due to a rising channel

– AGG (F Fund) – support near today’s low, longer support from the previous February 2016 high; more support just below at the September 9th low; reversal up possible

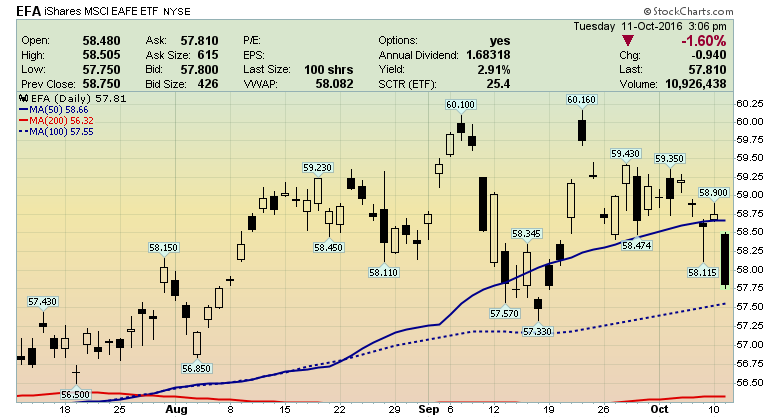
EFA (I Fund) – range-bound, and with negative momentum
 Prior to the most recent dip of about 2.5% on September 9th, the markets had traded in the 4th tightest range since 1928 for over 40 days, with no move on any day more than +/- 1% over the previous day. That rather dramatic, all-day, September 9th sell-off was generated by Fed governor’s strong suggestions of a September rate hike, which ultimately did not happen. With only one rate hike in the past 9 years(!), done last December, it is most irrational, thinking that a quarter point increase is nothing more than a mosquito bite in the long term scenario. This comes from decades of fearing a recession brought on by Fed rate hikes. The Fed has a gun with only 1 bullet, from last December’s rate hike. We are going to see a recession at some point in the next 18-24 months and the Fed is desperate to reload by adding some rate hikes to their arsenal. The higher the interest rate when we reach the next recession, the more times they will be able to cut to slow those recessionary forces. They only have one bullet today and it is scaring them because they see the long-term outlook.
The challenge is figuring out which way it is likely to break and then get in front of the move. The deception of a balance between an eventual breakout (up), and a breakdown (down) might find clues with this table. It shows over 60% of these U.S. and European indices having more than a month since their last high, and/or, currently riding BELOW their 50 day averages.
The next table shows how a majority of market levels in the U. S. and Europe are, once again, looking backward from today at their highest levels.
The 50DMA represents the average of the last 50 days on a moving average basis.
They are in order from the oldest date of hitting their recent highest level.
| 50DMA | Last High | |||
| Above | Below | 3 months ago | ||
| Dow Utilities | x | 7/7/16 | ||
| Dow Composite | x | 7/11/16 | ||
| Previous Weather Report | 7/18/16 2 months ago |
|||
| S&P500 | x | 8/9/16 | ||
| Dow Industrials | x | 8/15/16 | ||
| Russell 1000 | x | 8/15/16 | ||
| S&P100 | x | 8/15/16 | ||
| DAX – Berlin | x | 8/15/16 | ||
| Russell 3000 | x | 8/23/16 1 month ago |
||
| S&P400 | x | 9/6/16 | ||
| S&P600 | x | 9/6/16 | ||
| American Comp | x | 9/6/16 | ||
| Wilshire 5000 | x | 9/6/16 | ||
| NY Composite | x | 9/7/16 | ||
| CAC – Paris | 9/8/16 | |||
| Toronto | x | 9/11/16 | ||
| Canadian Venture | x | 9/11/16 | ||
| Nasdaq | x | 9/22/16 | ||
| Nasdaq 100 | x | 9/22/16 | ||
| Russell 2000 | x | 9/22/16 | ||
| Dow Transportation | x | 10/3/16 | ||
| FTSE (London) | x | 10/4/16 | ||
The longer the passage of time, the lower the likelihood of a continuation to higher levels, and the greater likelihood of stagnation, higher risk, and/or weakness/losses.
BREXIT Plus 90 Days
The initial market snap back in late June that accompanied the referendum was just a bit of ‘kicking the can’, given the reaction to the initial shock, leading to the long process involved from the vote to the execution. Now, after the resignation of David Cameron, and the installation of Theresa May, it’s now time to get to work.
Now, the question is whether there will be a ‘soft’ (best case), or a ‘hard’ (worst case) BREXIT scenario! There are too many variables involved for anyone to accurately project.
“It is in everyone’s interests for there to be a positive outcome to the negotiations that is mutually beneficial for the U.K. and the EU, causes minimum disruption to the industry and benefits customers,” said Miles Celic, chief executive officer of lobby group TheCityUK.
Adam Marshall, acting director general at the British Chambers of Commerce, said “in a period of historic change, business communities all across the U.K. need to feel supported, not alienated.”
May’s strategy amounts to a bet that voters’ opposition to immigration outweighs all else and that the economy will find support from easier fiscal policy, new trade deals emerge and banks don’t flee London, said Simon Tilford, deputy director at the Center for European Reform. The political payoff could be more support for her Conservatives at a time when the opposition Labour Party is in disarray.
“May wants to give the people what they want and thinks that the people voted for a hard Brexit and that the economic costs are exaggerated,” said Tilford. “A lot of this has to do with Conservative Party unity and she has a better chance of unifying the party going for a hard Brexit.”
Meanwhile, despite “Brexit,” weakening economic growth, declining profitability, terror attacks, Presidential election antics, and Deutsche Bank, the markets continue to cling to its bullish trend. Investors, like “Pavlov’s dogs,” have now been trained the Fed will always be there to bail out the markets. But then again, why shouldn’t they? The chart below shows this most clearly. (***click chart for better view, then, press back button to return***)

Recession Indications
Several measures of the probability of a recession have recently appeared.
Existing home sales in August totaled 5.33mm, 120k less than expected and down from 5.38mm in July. This is the slowest pace of closings since February.
Unemployment – September’s jobs report contained a sign that investors should be on alert for a U.S. recession, judging by bond guru Jeff Gundlach’s favorite warning signs. (***click chart for better view, press back button to return***)
During a panel discussion at the New York Historical Society back in May, the Doubleline Capital LP chief executive officer revealed that one of his top three recession indicators was when the unemployment rate breaches its 12-month moving average.
Over the past year, the trend in the unemployment rate has flipped from improving to deteriorating.
“This indicator is a necessary, but not sufficient, sign of a coming recession,” wrote Gundlach in an email to Bloomberg. “It is worth factoring into economic analysis but not a reason for sudden alarm.”
Auto Sales – The first is that while the ‘annualized’ reported sales number was near the highest in 10-years, the historical average of cars sold is still at levels below both previous peaks. Secondly, and more importantly, is both previous peaks in total auto sales were preceded by a decline in the annual percentage change of cars sold.

In September, US commercial bankruptcy filings soared 38% from a year ago to 3,072, the 11th month in a row of year-over-year increases, according to the American Bankruptcy Institute.
Commercial bankruptcy filings skyrocketed during the Financial Crisis and peaked in March 2010 at 9,004. Then they fell on a year-over-year basis. In March 2013, the year-over-year decline in filings reached 1,577. Filings continued to fall, but at a slower and slower pace, until November 2015, when for the first time since March 2010, bankruptcy filings rose year-over-year. That was the turning point. Note that there is no ‘plateauing’:”

07182016 July 18, 2016
Posted by easterntiger in economy, financial, markets.Tags: bonds, central banks, f fund, interest rates, momentum indicator, S&P 100, S&P 500, S&P Utility, wilshire 5000 index
add a comment
Current Positions (No Changes)
I(Intl) – exit; S(Small Cap) – exit; C(S&P) –exit
F(bonds) – up to 75%; G (money market) – remainder
======================================================
Weekly Momentum Indicator (WMI) last 4 weeks, thru 7/18/16
(S&P100 compared to exactly 3 weeks before***)
+42.11, +69.03, +26.59, +0.78
======================================================
(Today from 2 Fridays ago; 2 Fri’s fm 4 Friday’s ago; 3 Fri’s fm 5 Friday’s ago; 4 Fri’s fm 6 Friday’s ago)
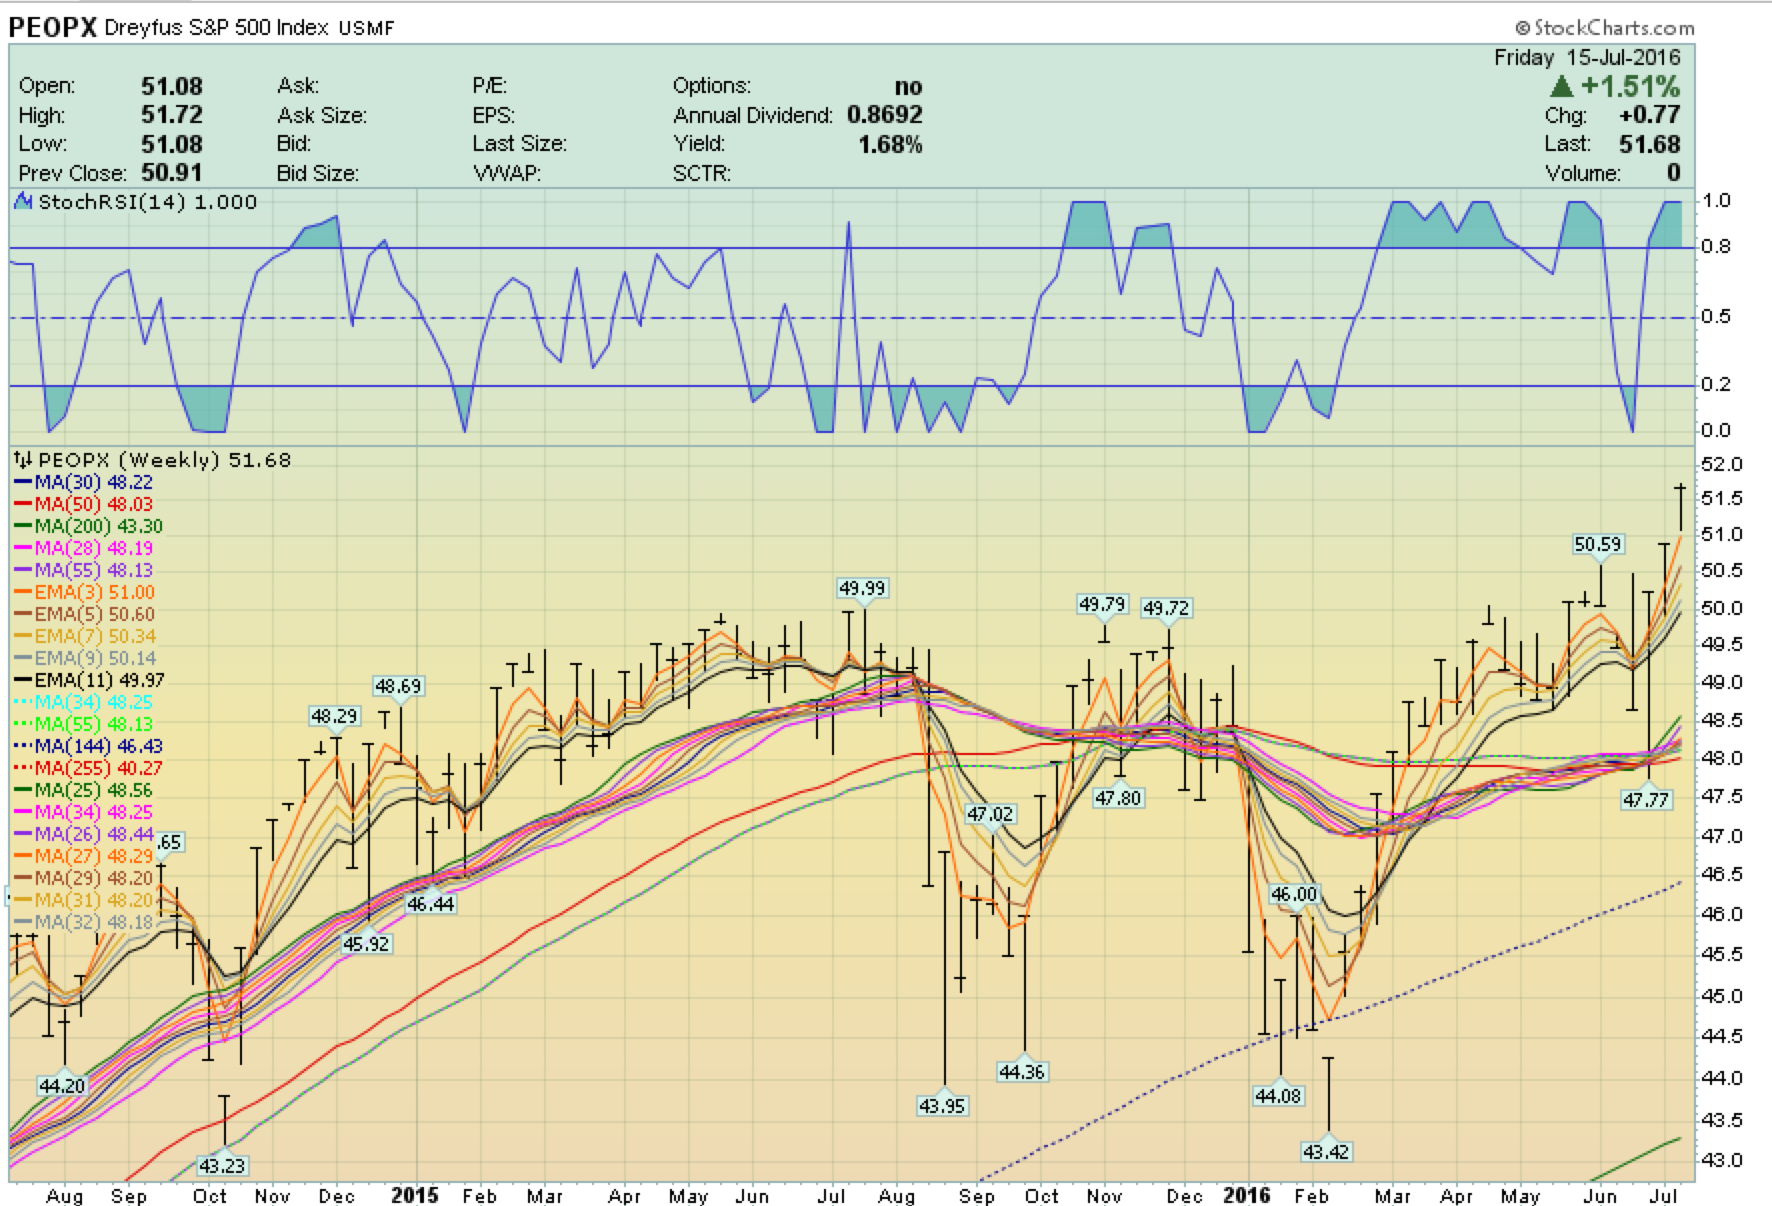
TSP Fund Proxies One Year Returns, as of 7/15/16
F fund/+5.77% YTD, I fund/-10.00% YTD
S fund/-3.36% YTD, C fund/+3.57% YTD
So, while everyone is expected to say ‘…wow – another new all-time-high…’, right after they just said, ‘…that BREXIT thing wasn’t so bad after all…’. You should already know that the reality isn’t quite that simple.
Reality check – One Year Return – S&P500 +1.99%, Dow Industrials +2.33%
Events like BREXIT are not measured in their direct effects. They’re measured in all the varied knock-offs – such as the weaker Pound, destabilized Euro and the stronger Dollar, and how those flow through economies.
“Italy Eyes $40bn Euro Bank Rescue As First BREXIT Domino Falls”
An Italian government task force is watching events hour by hour pledging all steps necessary to ensure the stability of the banks. “Italy will do everything necessary to reassure people”, said Premier Matteo Renzi.
“This is the moment of truth that we’ve all been waiting for for a long time. We just did not know that it would be BREXIT to let the elephant loose”, said a top Italian banker.
The index for Italian banks has fallen -30% since the British EU referendum on June 23, and is -61% lower than a year ago.
Failure of the Italian banking sector is not so threatening to our positions, or, for our direct interests. It’s the potential impact of the failure of Italy’s banking sector on the rest of the Italian economy that could act in a ripple effect fashion, from that banking crisis, which could, in turn, push Italy back into recession and, in a doomsday scenario, generate a Greek-type meltdown that Europe would find almost impossible to contain.
“The UK referendum hit an already vulnerable banking system in the eurozone. Italian banks are on the front burner, but the temperature is rising in Portugal,” Marc Chandler, the global head of currency strategy at Brown Brothers Harriman, wrote in a Monday note to clients.
Things aren’t looking super great going forward, amid higher oil prices and the overall sense of uncertainty in post-BREXIT Europe.
Barclays forecasts that growth will fall below 1% in 2016, while a Citi Research team led by Ronit Ghose noted that the negative growth effects from the BREXIT were likely to hit periphery countries — i.e. Portugal, Spain, Italy, and Greece — harder.
Where are the ‘all-time highs? Unfortunately, only in selected places where we can profit….
These are the percentage increases above the previous highs, with each ‘Y’.
Those with ‘N’ are indexes that are NOT at all-time highs!!!
New All-Time Highs
S&P500, Dow Industrials, S&P MidCaps,
Russell 1000, S&P600 Small Caps, S&P400 MidCap Exchange Traded Fund
No New All-Time Highs
NASDAQ, New York Stock Exchange, Russell 2000 Small Caps,
London Financial Times Index, Wilshire 5000, Down Transportation Index,
American Exchange
New All-Time Low
10-Year Treasury Note, 30-Year Treasury Bond
F Fund – Two Years

C Fund – Two Years (higher YTD, but, with significant downside risk)
I Fund – Two Years

S Fund – Two Years (Also, higher YTD, but, with significant downside risk)

Lance Roberts of ‘Real Investment Advice’ points out some inconvenient facts.
“It is worth reminding you, that while the markets are moving higher and pushing new highs currently, it is doing so against a backdrop of weak fundamentals, high valuations, and deteriorating earnings.”
Of the current price levels, Blackrock CEO Larry Fink says, “If we don’t see better-than-anticipated corporate earnings I think the rally will be short-lived,” he added.
Considering that on a GAAP (accounting) basis, the S&P500 is currently generating about 90* in earnings, or equivalent to a 24x P/E multiple, it is hard to see how one can justify the move “fundamentally.”
* – currently at 86.44, and, that’s down from 105.96 last year at the peak.
Fink said extraordinary central bank asset purchases has been inflating stocks prices. “I don’t think we should be at new [stock] highs,” he said. “All the stock repurchases, you’re seeing this reduction in investable assets.”
Artificially boosting stock prices through convoluted liquidity schemes, devious machinations, backroom central banker deals, sending Bernanke to Japan, and helicopter money dropped on Wall Street only, has just exacerbated the wealth inequality permeating the world. The anger over this blatant pillaging by the .1% who rule the world is reflected in the chaos across Europe and the brewing civil war here in the U.S.
No wealth is being created because no productive investments are being made.
Here is a chart of earnings levels, clearly showing a quarter-over-quarter decline that began over a year ago.

Let’s assess the progression closely…
- The Fed kept rates at ZERO for seven years.
- The Fed raised rates just ONCE in the last 10 years.
- The Fed spent over $3 trillion in QE.
- Total central bank printing totaled $20 trillion since 2008.
Let’s assess the most recent headlines…
The three largest banks in the US—Bank of America, JPMorgan Chase, and Wells Fargo—disclosed that the number of delinquent corporate loans increased by 67% in Q1.
- JPMorgan’s delinquent corporate loans increased by 50% to $2.21 billion
- Bank of America’s delinquent loans increased 32% to $1.6 billion
- Wells Fargo’s delinquent loans increased by 64%, to $3.97 billion
US Industrial Production Declines For 10th Straight Month – Longest Non-Recessionary Streak In History
Retail Sales Jump On Downward Revisions, Hover At Recessionary Ledge
Empire Fed Unexpectedly Drops As New Orders Tumble, Labor Conditions Deteriorate
Don’t get caught up in the hype of a minor upward price advantage.
The memories of losses nearing 10%, twice in the past year, have faded from the presses.
These minor single-digit YTD gains will also fade quickly once the weight of the fundamentals begins to take it’s toll.
06232016 June 23, 2016
Posted by easterntiger in economy, financial, markets, stocks.Tags: bonds, central banks, economic theory, f fund, interest rates, momentum indicator, S&P 100, S&P 500, treasury note
add a comment
Current Positions (No Changes)
I(Intl) – exit; S(Small Cap) – exit; C(S&P) –exit
F(bonds) – up to 75%; G (money market) – remainder
======================================================
Weekly Momentum Indicator (WMI) last 4 weeks, thru 6/23/16
(S&P100 compared to exactly 3 weeks before***)
-1.89, -13.58, 16.45, +19.5
======================================================
(Today from 2 Fridays ago; 2 Fri’s fm 4 Friday’s ago; 3 Fri’s fm 5 Friday’s ago; 4 Fri’s fm 6 Friday’s ago)
TSP Fund Proxies Year-To-Date
Top left – F fund/+4.04% YTD, Top right – I fund/+1.46% YTD
Bottom left – S fund/+2.87% YTD, Bottom right – C fund/+4.15% YTD
(press any image to expand – press ‘x’ button at top left to return)


From the Weekly Momentum Indicator on the S&P100, notice the TWO POINT difference in price from today from NINE DAYS ago!
‘The market is up/The market is down’ virtually means nothing when the market is crossing back and forth in the same area for weeks and months at a time.
The high’s made in May/June of 2015 have still not been broken. Year-to-date is still fluctuating between single-digit plus or minus gains or losses.
Today, as all week, the entire financial world is hovering around the outcome of the referendum on whether the United Kingdom will ‘BREXIT’ or ‘BREMAIN’ in the European Union. The results are expected sometime tonight with an immediate reaction in the world equity/currency/bond markets tomorrow. The immediate impact is expected to be fairly ‘huge’ given recent narrow ranges. A ‘BREMAIN’ will be seen as a stabilizing influence on the Eurozone, resulting in a positive direction on many, if not all, markets worldwide. A ‘BREXIT’ will be seen as a very negative signal. Prices would then expected to show immediate and possibly substantial penetration into the RED zones, reflecting the instability that an exit from the European Union by the United Kingdom would mean.
While the UK only represents 3% of world GDP, the economic impact of an exit has been summarized by legendary investor/trader George Soros, as a consequence of a devaluation of the British Pound – “Too many believe that a vote to leave the EU will have no effect on their personal financial position,” he adds. “This is wishful thinking. It would have at least one very clear and immediate effect that will touch every household.”
Soros cites data from the Bank of England, the International Monetary Fund, and the Institute for Fiscal Studies stating that if Britain leaves the EU, the average U.K. household will lose £3,000 to £5,000 annually.
Underneath the surface, in the bigger picture ‘beyond the BREXIT’, and regardless of the short-term momentum after the vote, by next week, expectations are for some downward pressure on all the equity indexes. Following the indications from the Federal Reserve over the past two weeks, of a plan to delay raising rates based upon conflicting data, the F fund has surged relative to a two-year low in benchmark (10-year treasury note) interest rates last week. As a side note, these low interest rates have not translated to an increase in housing demand. This is a significant sign of other dragging factors at work, possibly tightening consumer credit conditions, income stagnation, or consumer risk aversion. OTHER SIGNS OF ECONOMIC WEAKNESS are beginning to emerge. Consumer spending and U. S. GDP is expected to lag in the lower end of recent ranges into next year. Equity prices, already losing momentum from the loss of (1) Fed-sponsored Quantitative Easing (QE) since October ’14, (2) the peaking of New York Stock Exchange (NYSE) margin debt over a year ago (May ’15) and, finally, (3) the recent estimate of stock buybacks, from JP Morgan Quant Marko Kolanovic, who announced that buybacks have dropped 40% ($250 billion) on a 12-month trailing basis. Share buybacks take approximately 6 quarters to execute so the recent drop will translate into roughly $40 billion less equity demand per quarter. In the chart below, notice how the S&P500/C Fund has remained in an upper range, IN SPITE OF the decline in buybacks. This WILL be reconciled in the coming quarters. The three elements are/were the primary sources of U. S. equity strength for the past 7 years. Many other world indexes are already off in to negative ranges for the year.
Risk continues to rise, even as prices appear to be unfazed.
05232016 May 23, 2016
Posted by easterntiger in economy, financial, gold, markets, oil, silver, stocks.Tags: bonds, central banks, economic theory, f fund, gold, interest rates, momentum indicator, oil, QE, S&P 100, S&P 500, silver, stock market, stock market index, treasury note
add a comment
Current Positions (No Changes)
I(Intl) – exit; S(Small Cap) – exit; C(S&P) –exit
F(bonds) – up to 75%; G (money market) – remainder
======================================================
Weekly Momentum Indicator (WMI) last 4 weeks, thru 5/20/16
(S&P100 compared to exactly 3 weeks before***)
-6.62, -20.76, -11.11, +6.71
======================================================
(Friday from 3 Fridays ago; 2 Fri’s fm 4 Friday’s ago; 3 Fri’s fm 5 Friday’s ago; 4 Fri’s fm 6 Friday’s ago)
TSP
As the calendar flips to May, the U.S. stock market enters what is historically its worst six months of the year, in which it typically under-performs the November-April time frame.
This is a well-documented seasonal trend with solid historical numbers behind it. It begs the question: Should investors follow the old Wall Street adage to “sell in May and go away?”
The numbers back it up. Looking at stock market history back to 1950, most of the market’s gains have been made from November to April and the market has generally gone sideways from May to October, says Jeffrey A. Hirsch, editor in chief at Stock Trader’s Almanac.
The November-April period produced an average gain in the Dow Jones industrial average of 7.5 percent since 1950 compared to an average gain of just 0.4 percent from May to October, Hirsch says.
This is just one more reason why I will maintain high allocations to our F Fund, as I have for much of the past 3 years, due to increasing risk and subsequent under-performance of C, I and F funds as compared to the F Fund. The attractiveness of the F fund has mirrored the lack of increases in interest rates, relatively speaking, from multi-decade, near zero lows. This lull in rate pressure is in spite of continuous Fed rhetoric projecting rate increases, since the end of Quantitative Easing (QE) in the 4th quarter of 2014. A continued threat to raise rates is simply a ‘bluff’ tactic, meant to broadcast confidence to the rest of the world of our economic condition. This is meant to continue to competitively attract capital from other world markets into our U. S. markets. It is a very risky proposition, given the threat that higher interest rates, even from these generational low levels, can impact on our equally fragile and debt-ridden consumer, government and business purses.
For the following charts, imagine that you had half in F and half in the other fund. When it rises, the other fund beat the F; when it fell, the F fund beat the other half.

S&P 500/C Fund Performance compared to AGG/F Fund Over the Past Two Years
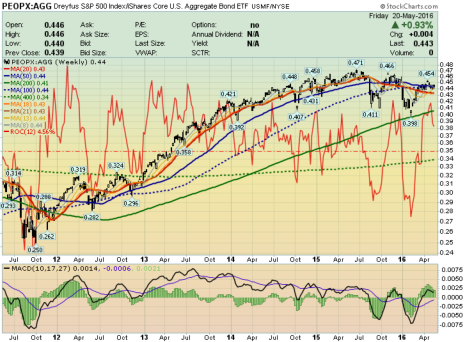
S&P 500/C Fund Performance compared to AGG/F Fund Over the past 5 Years
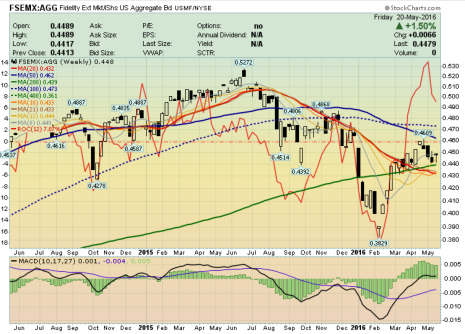
Small Cap/S Fund Performance compared to AGG/F Fund Over the past 2 Years
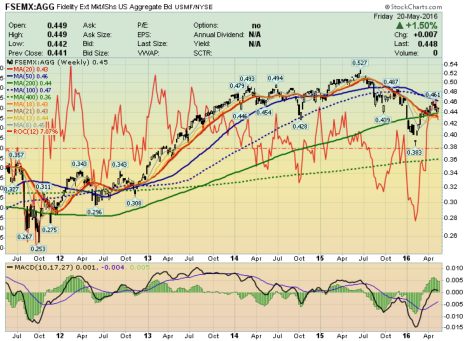
Small Cap/S Fund Performance compared to AGG/F Fund Over the past 5 Years
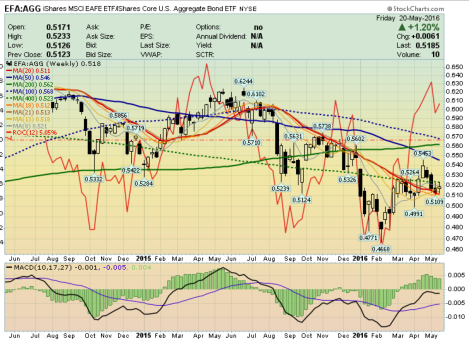
International/I Fund Performance compared to AGG/F Fund Over the past 2 Years
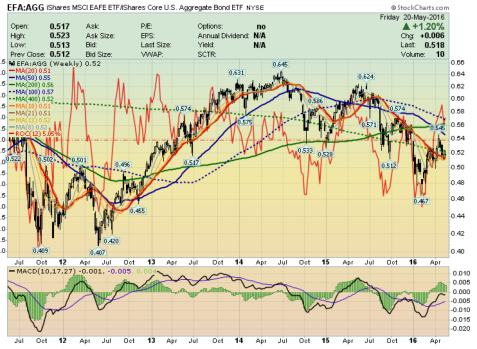
International/I Fund Performance compared to AGG/F Fund Over the past 5 Years
Stocks
Fed officials have been preparing the groundwork for a rate hike for more than a month, having issued about a dozen warnings through the media. Problem is, the Fed’s credibility is so badly shattered, that few traders actually believe what Fed officials are saying these days.
On April 28th, more than 80 economists polled by Reuters said that they were expecting two rate increases this year, with the first hike coming as early as June. “The Fed’s next interest rate hike will surely cause market pain, but the Fed should just get it over with as soon as possible,” former Dallas Fed chief Fisher warned on April 28th. “I would be prepared when they move, and I hope they move in June — there’ll be a settling in of the market place. There will be a correction. Suck it up. Deal with it. That’s reality,” he told listeners of the television station, -CNBC.
The weekly chart of the S&P 500 Index (SPX) is labeled as a bearish Elliot Wave 5. This fifth wave typically takes the chart subject down to a new low, after it has completed 4 waves with lower highs and lower lows.

How many bull markets have spent an entire year without making new highs? The answer is just thirteen since the 1940’s.
How many eventually did achieve new highs? Just two.
That is out of thirteen times bull markets did not reach new highs in the last sixty years.
What happened to the other eleven times stocks did not reach new highs for a year in a bull market?
You guessed it. Those eleven times ended in bear markets. So history tells us there is an 11/13 chance we are headed for a bear market. That is 85% for those with calculators.
Sounds simple, but the current market conditions are difficult. One day we are up and the next down. Rallies feel solid but never break out. Declines look like the end has arrived, but then they bounce back.
Smart investors have noted that the S&P 500 just staged a very dangerous looking move.
That move was when S&P 500’s 50-week moving average broke below its 100-week moving average. You can see this in the green circle below. We cannot rule out the high probability of a ‘waterfall decline, similar to the 4-day 12% plunge of last August.
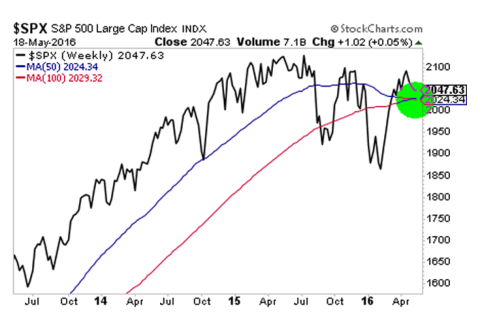
This move is called a “Death Cross” and for good reason. The last time it happened was in 2008, right before the entire market CRASHED. This is another case of a ‘waterfall’ decline.

The time before that was right before the Tech Bubble burst, crashing stocks.
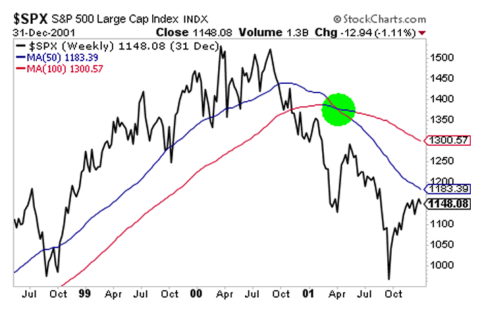
In short, going back over 16 years, this Death Cross formation has only hit TWICE before. Both times were when major bubbles burst and stocks Crashed.
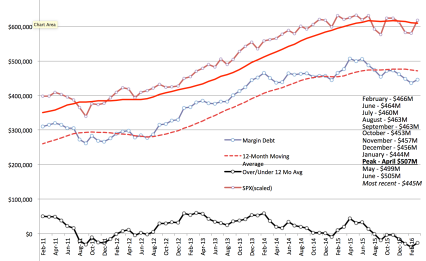
Margin Debt
A primary fuel for market progress, margin debt, continues to show a peak over a year ago, a month before market prices also peaked. The last SEVEN consecutive months have been below the 12-month moving average. This is the first time since 2011 that this has happened. That period coincides with a 20% decline in market prices around that point.
Bonds
Notice the actual declining trend in interest rates over the past 20 years, and even in view of the so-called ‘economic recovery’ of the past decade. There is something more involved at work than these short-term ‘bullish’ economic aspects, much of it under the increasing Fed-funded burden of higher debt levels on Fed balance sheets (over $4 trillion in the past 7 years alone). Long-term economic strength is fuel for higher rates, not lower rates.
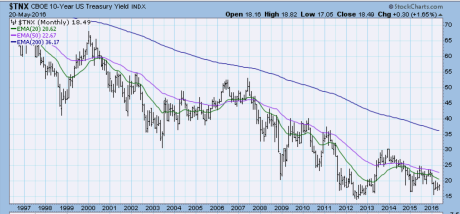
I’ve placed my bets on lower interest rates for the past 13 years, and, I’ve only been proven wrong for very, very short periods of time.
Precious Metals
The demand for Gold surged +21% in Q’1 of 2016, – the fastest pace on record, according to a May 12th-World Gold Council <WGC> report. WGC officials attributed the rise to 4 principal factors: 1- negative interest rates in Japan and Europe; 2- the chance of a devaluation of China’s Yuan; 3- the likelihood of a slower trajectory of Fed rate hikes – than suggested by the Fed’s “Dots Plot,” and 4- expectations of a weaker US$.
A quote from legendary trader and investor W. D. Gann sets the stage for the current state of the gold/silver/platinum/palladium markets.
“Anytime a market exceeds the largest percentage decline or the largest time period of the corrections on the way down in a bear market, it is showing that the momentum is shifting and that buying pressure is finally overcoming selling pressure.”
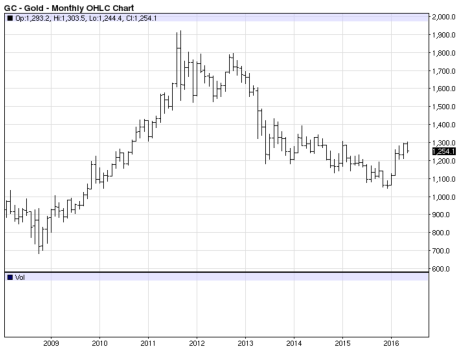
Marshaling the evidence, in the gold there has never been a bear market rally which has exceeded the preceding bear market rally highs on the way down. Our advance has exceeded the previous two.
Only the 48% bear market rally in 1980 in the aftermath of the greatest bull market in history and the 27% advance in 2008 in the midst of the financial crisis have been greater in percentage terms than our 25% advance. Our DNA doesn’t match these two at all. The only conclusion we can draw is that we have a 1st leg up in a new bull market and not a bear market rally.
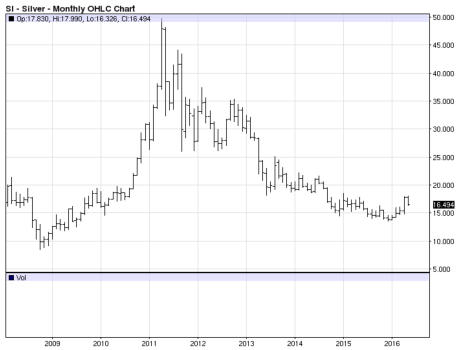
Silver hit record demand in 2015, but had its third successive annual deficit, which was 60% larger than 2014. These were just a few of the findings of this year’s report. However, the report is backward looking and the silver market is much different today than it was towards the end of last year. Erica Rannestad, precious metals demand senior analyst for Thomson Reuters GFMS, agreed in that interest for silver has shifted, which is helping to support prices this year. “First off, in the past 2-3 years, you’ve seen bargain buying. This year, you’ve seen a lot more safe-haven buying, which has been pushing prices higher,” she explained.
Oil
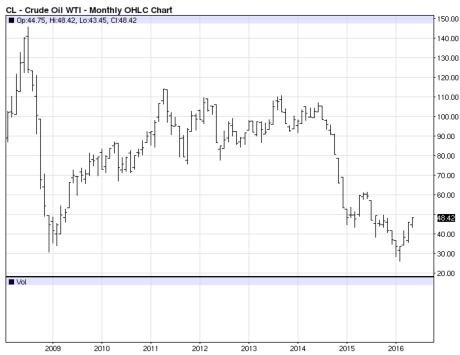
There are a lot of tankers sitting off the coast of Singapore waiting for a price increase and refinery availability to dump their cargo (http://www.zerohedge.com/news/2016-05-20/something-stunning-taking-place-coast-singapore ). South American suppliers are trying to sell every drop to have available funds to ensure the population is fed, staving off utter collapse and revolution. India is even trading drugs for oil now. Middle Eastern suppliers are holding supply steady in an attempt to make enough money to support their lifestyles and basic requirements. International refineries are working as fast as they can to turn over supply in hopes of being able to pay their bills. All of this will have a short term cap on prices.
Longer term, as players go bankrupt and governments are overthrown, then supply will be limited into a market of relatively stable world demand. This will drive prices higher, but it is a couple of years away, at least.
In the short term, expect that every approach of WTI Crude Oil near the 50 level will be sold off.
09252015 September 25, 2015
Posted by easterntiger in economy, financial, markets, stocks.Tags: bonds, central banks, China, S&P 100, S&P 500, S&P Utility, stocks, treasury note
add a comment
Current Positions (Changes)
I(Intl) – exit; S(Small Cap) – exit; C(S&P) –exit
F(bonds) – up to 75%; G (money market) – remainder
Weekly Momentum Indicator (WMI) last 4 weeks, thru 09/24/15
(S&P100 compared to exactly 3 weeks before***)
4.88, -17.54, -1.76, -72.95
(Today from 3 Fridays ago, 2 Fri’s fm 4 Friday’s ago, 3 Fri’s fm 5 Friday’s ago, 4 Fri’s fm 6 Friday’s ago)
It’s now a month after the largest decline in 4 years. The dust has cleared. Any doubts about the very first Fed action after the first correction in 4 years are now in the books.
In the chart below, the biggest question, before and after last week’s Fed meeting, is which way the ‘ascending wedge’ formation would resolve – breaking upward or downward.
Bulls were certain that this was a bullish ‘consolidation’. And, with no rate increase last week, they were confident of a rebound. That confidence proved to be incorrect.

(click for a closeup, then, back button to return)
Also leading into last week’s Fed meeting, the ‘exposure index’ from the National Association of Active Investment Managers hovered in the range near one-year lows. Since the Fed meeting, that exposure level is now lower than in the previous two weeks, and, is now at the low for the year. Investment managers are not interested in increasing their exposure to stocks at this time. Prices should continue to weaken near term. HOWEVER – prices in this upcoming quarter characteristically rise from August/September/October lows and into late November to mid-December highs. This all-too-often phony ‘advance’ back to old highs meets the needs of fund managers who do not want a negative return in their portfolios for the year. That justifies a bonus for them in January. Don’t count on these advances holding up into the next quarter. Any rise that does not exceed the highs for the year, established in May and June, depending on the index, should simply be classified as ‘noise’. Only an advance that exceeds those May/June highs should be taken seriously. That stronger advance, past highs of the year, is highly unlikely.
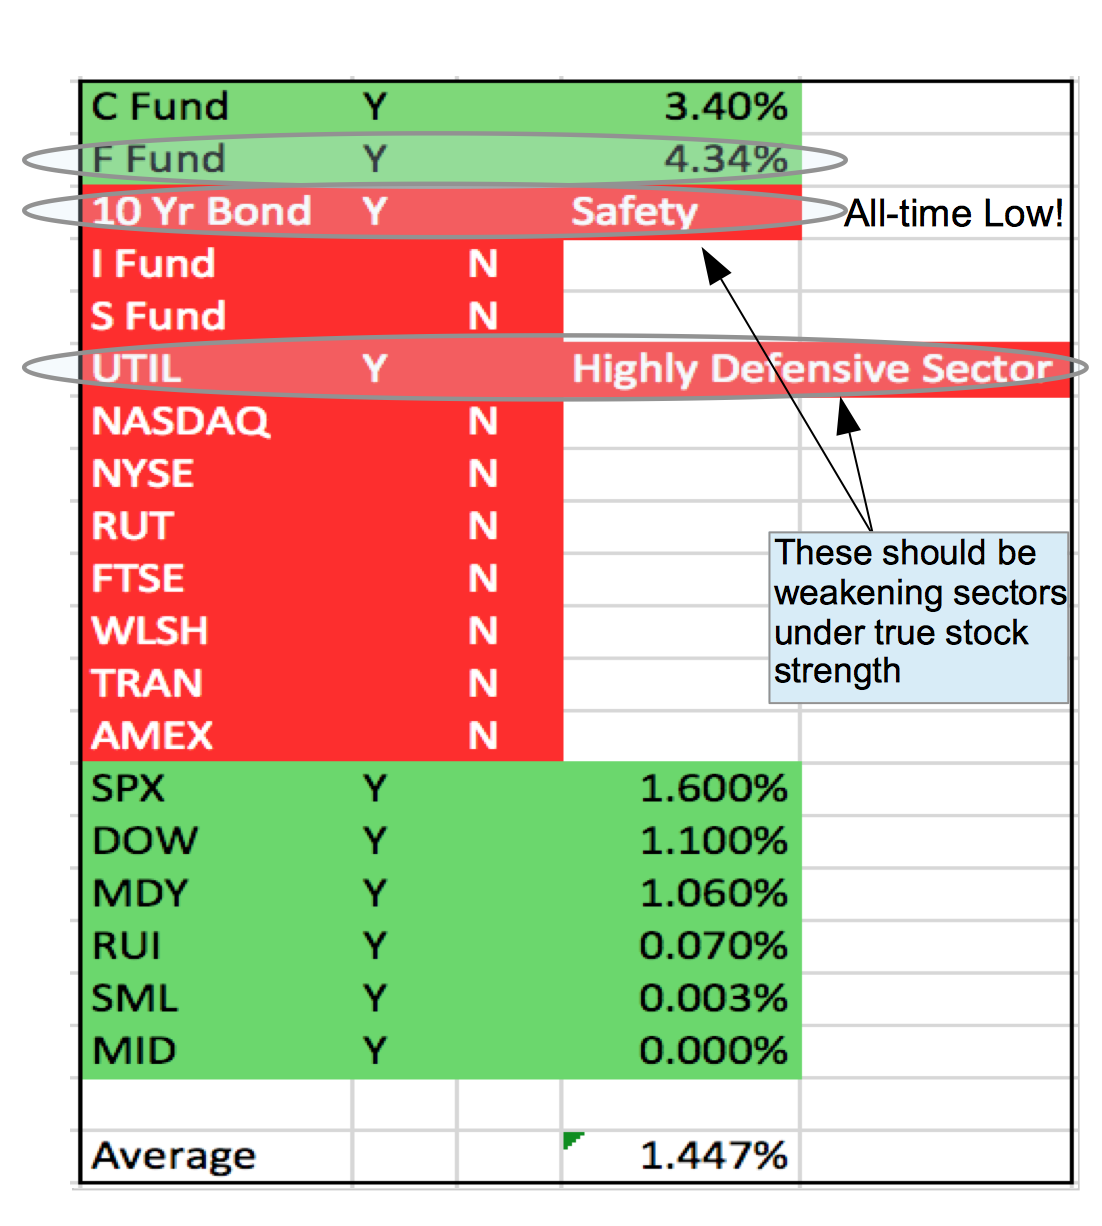
In the past week, a measurement of buying interest in the various S&P components/indexes has indicated a similar pattern of low and declining buying interest, if not, outright selling interest.
 The only sector with any increase in buying interest is the S&P Utility sector. This is a bearish indication, one of a search for safety, protection and avoidance of risk. This is a reiteration of the expectation for a further decline, or increasing risk, in stock indexes.
On Wednesday, stocks worldwide began the morning with another beating after a scandal at Volkswagen (deliberately altering emissions results on up to 11 million cars). The impact of this scandal is far-reaching, threatening the company itself, the health of German economy, and, with ripple effects to all of Volkswagen’s inter-connected supply chains world-wide.
The expected increase in the ‘flight to quality’ trade, of increasing interest in bonds, did not fully materialize, even as stocks broke down last month. The one obstacle to the increases that should have occurred in our F fund positions were due to the flooding of the bond market of our bonds, previously purchased from us, by the Chinese central banks, at the very time that the demand for our bonds increased, and, during the times of highest overall risk. These high risk conditions are normally the times when bond prices rise fastest. You can’t blame them for adding their supplies to the market (dumping!) when they knew that the demand was also present. Everyone has to strike while the iron is hot. If not for that event, our F fund would have received a higher rate of increase, due to the rush of money out of stocks.
 (click for a closeup, then, back button to return)
Therefore, I am increasing my stake in the F fund, until this bond price trend reaches a peak, or, until stocks manage to bottom or regain their footing, due to increases in exposure by investment managers, or, the strengthening in the S&P sectors buying interest.
In the grander scheme, I noticed the emergence of a pattern that has only occurred 3 other times in the past 15 years. In the previous 3 instances, stocks continued to decline by (1) 40% from the 2000 highs, (2) 53% from the 2007 highs, and (3) 20% from the 2011 highs. So far, we have only declined by 10%. It is highly likely that we are only halfway, or less, down to our eventual bottom, toward -20%, or more, from the highs of the year.
 (click for a closeup, then, back button to return)
Additionally, a momentum measure called ‘relative strength index’ has fallen below a critical level, one that has only been reached, on a decline, for now only the 3rd time in 15 years. If the current decline continues into October, we will be into our 6th quarter, moving beyond 20 months, within a narrow, ‘topping’ range. This will increase the likelihood of this meeting the classification of a major top, and increasing the likelihood of a significant decline within the next 6-8 quarters.


