05232016 May 23, 2016
Posted by easterntiger in economy, financial, gold, markets, oil, silver, stocks.Tags: bonds, central banks, economic theory, f fund, gold, interest rates, momentum indicator, oil, QE, S&P 100, S&P 500, silver, stock market, stock market index, treasury note
trackback
Current Positions (No Changes)
I(Intl) – exit; S(Small Cap) – exit; C(S&P) –exit
F(bonds) – up to 75%; G (money market) – remainder
======================================================
Weekly Momentum Indicator (WMI) last 4 weeks, thru 5/20/16
(S&P100 compared to exactly 3 weeks before***)
-6.62, -20.76, -11.11, +6.71
======================================================
(Friday from 3 Fridays ago; 2 Fri’s fm 4 Friday’s ago; 3 Fri’s fm 5 Friday’s ago; 4 Fri’s fm 6 Friday’s ago)
TSP
As the calendar flips to May, the U.S. stock market enters what is historically its worst six months of the year, in which it typically under-performs the November-April time frame.
This is a well-documented seasonal trend with solid historical numbers behind it. It begs the question: Should investors follow the old Wall Street adage to “sell in May and go away?”
The numbers back it up. Looking at stock market history back to 1950, most of the market’s gains have been made from November to April and the market has generally gone sideways from May to October, says Jeffrey A. Hirsch, editor in chief at Stock Trader’s Almanac.
The November-April period produced an average gain in the Dow Jones industrial average of 7.5 percent since 1950 compared to an average gain of just 0.4 percent from May to October, Hirsch says.
This is just one more reason why I will maintain high allocations to our F Fund, as I have for much of the past 3 years, due to increasing risk and subsequent under-performance of C, I and F funds as compared to the F Fund. The attractiveness of the F fund has mirrored the lack of increases in interest rates, relatively speaking, from multi-decade, near zero lows. This lull in rate pressure is in spite of continuous Fed rhetoric projecting rate increases, since the end of Quantitative Easing (QE) in the 4th quarter of 2014. A continued threat to raise rates is simply a ‘bluff’ tactic, meant to broadcast confidence to the rest of the world of our economic condition. This is meant to continue to competitively attract capital from other world markets into our U. S. markets. It is a very risky proposition, given the threat that higher interest rates, even from these generational low levels, can impact on our equally fragile and debt-ridden consumer, government and business purses.
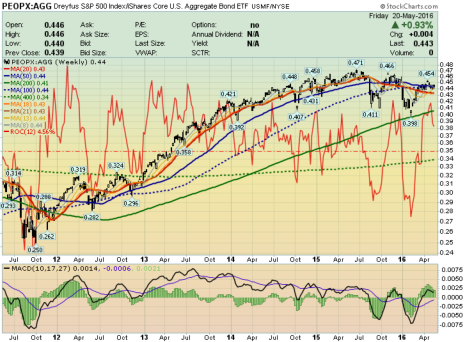
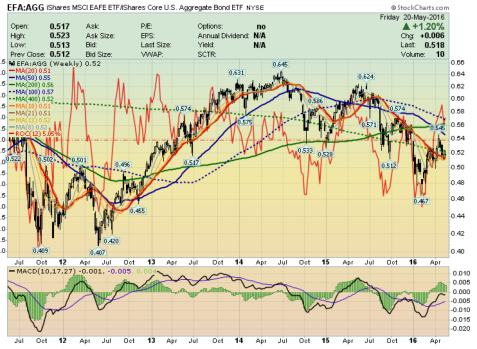
For the following charts, imagine that you had half in F and half in the other fund. When it rises, the other fund beat the F; when it fell, the F fund beat the other half.

S&P 500/C Fund Performance compared to AGG/F Fund Over the Past Two Years
S&P 500/C Fund Performance compared to AGG/F Fund Over the past 5 Years
Small Cap/S Fund Performance compared to AGG/F Fund Over the past 2 Years
Small Cap/S Fund Performance compared to AGG/F Fund Over the past 5 Years
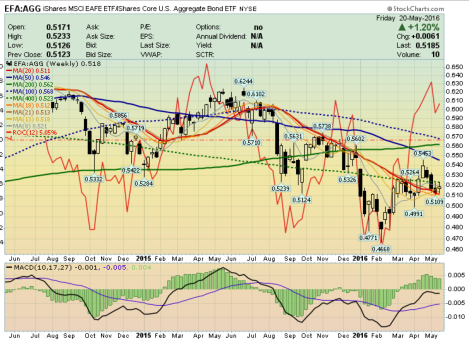
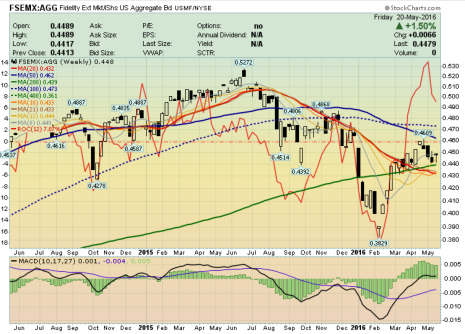
International/I Fund Performance compared to AGG/F Fund Over the past 2 Years
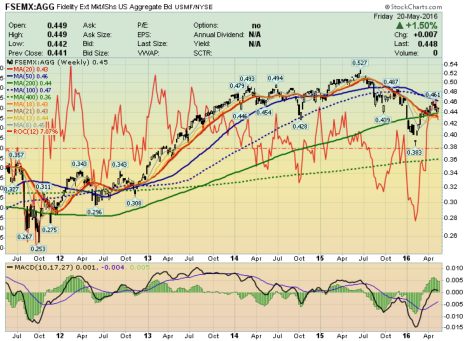
International/I Fund Performance compared to AGG/F Fund Over the past 5 Years
Stocks
Fed officials have been preparing the groundwork for a rate hike for more than a month, having issued about a dozen warnings through the media. Problem is, the Fed’s credibility is so badly shattered, that few traders actually believe what Fed officials are saying these days.
On April 28th, more than 80 economists polled by Reuters said that they were expecting two rate increases this year, with the first hike coming as early as June. “The Fed’s next interest rate hike will surely cause market pain, but the Fed should just get it over with as soon as possible,” former Dallas Fed chief Fisher warned on April 28th. “I would be prepared when they move, and I hope they move in June — there’ll be a settling in of the market place. There will be a correction. Suck it up. Deal with it. That’s reality,” he told listeners of the television station, -CNBC.
The weekly chart of the S&P 500 Index (SPX) is labeled as a bearish Elliot Wave 5. This fifth wave typically takes the chart subject down to a new low, after it has completed 4 waves with lower highs and lower lows.

How many bull markets have spent an entire year without making new highs? The answer is just thirteen since the 1940’s.
How many eventually did achieve new highs? Just two.
That is out of thirteen times bull markets did not reach new highs in the last sixty years.
What happened to the other eleven times stocks did not reach new highs for a year in a bull market?
You guessed it. Those eleven times ended in bear markets. So history tells us there is an 11/13 chance we are headed for a bear market. That is 85% for those with calculators.
Sounds simple, but the current market conditions are difficult. One day we are up and the next down. Rallies feel solid but never break out. Declines look like the end has arrived, but then they bounce back.
Smart investors have noted that the S&P 500 just staged a very dangerous looking move.
That move was when S&P 500’s 50-week moving average broke below its 100-week moving average. You can see this in the green circle below. We cannot rule out the high probability of a ‘waterfall decline, similar to the 4-day 12% plunge of last August.
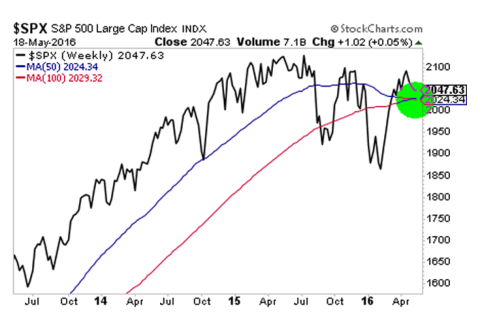
This move is called a “Death Cross” and for good reason. The last time it happened was in 2008, right before the entire market CRASHED. This is another case of a ‘waterfall’ decline.

The time before that was right before the Tech Bubble burst, crashing stocks.
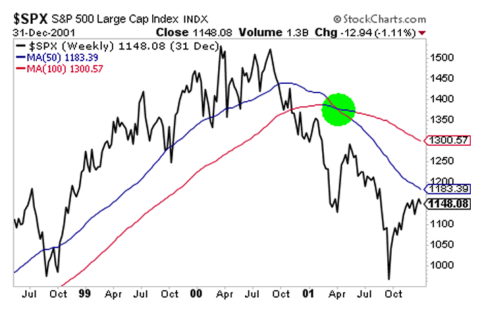
In short, going back over 16 years, this Death Cross formation has only hit TWICE before. Both times were when major bubbles burst and stocks Crashed.
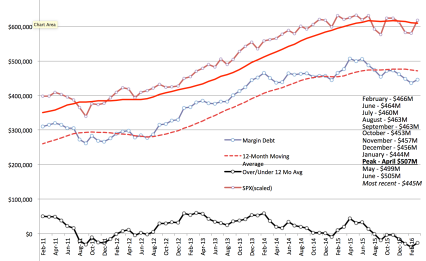
Margin Debt
A primary fuel for market progress, margin debt, continues to show a peak over a year ago, a month before market prices also peaked. The last SEVEN consecutive months have been below the 12-month moving average. This is the first time since 2011 that this has happened. That period coincides with a 20% decline in market prices around that point.
Bonds
Notice the actual declining trend in interest rates over the past 20 years, and even in view of the so-called ‘economic recovery’ of the past decade. There is something more involved at work than these short-term ‘bullish’ economic aspects, much of it under the increasing Fed-funded burden of higher debt levels on Fed balance sheets (over $4 trillion in the past 7 years alone). Long-term economic strength is fuel for higher rates, not lower rates.
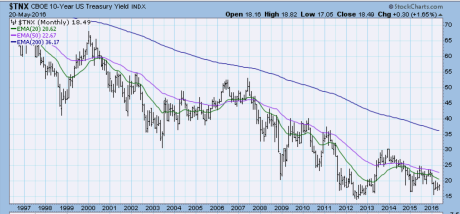
I’ve placed my bets on lower interest rates for the past 13 years, and, I’ve only been proven wrong for very, very short periods of time.
Precious Metals
The demand for Gold surged +21% in Q’1 of 2016, – the fastest pace on record, according to a May 12th-World Gold Council <WGC> report. WGC officials attributed the rise to 4 principal factors: 1- negative interest rates in Japan and Europe; 2- the chance of a devaluation of China’s Yuan; 3- the likelihood of a slower trajectory of Fed rate hikes – than suggested by the Fed’s “Dots Plot,” and 4- expectations of a weaker US$.
A quote from legendary trader and investor W. D. Gann sets the stage for the current state of the gold/silver/platinum/palladium markets.
“Anytime a market exceeds the largest percentage decline or the largest time period of the corrections on the way down in a bear market, it is showing that the momentum is shifting and that buying pressure is finally overcoming selling pressure.”
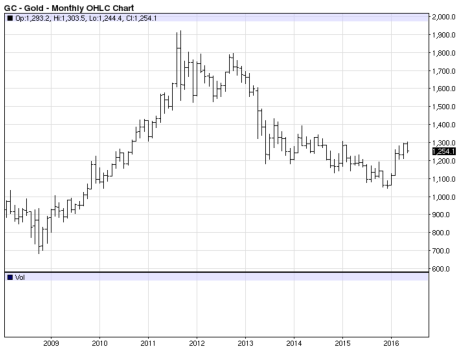
Marshaling the evidence, in the gold there has never been a bear market rally which has exceeded the preceding bear market rally highs on the way down. Our advance has exceeded the previous two.
Only the 48% bear market rally in 1980 in the aftermath of the greatest bull market in history and the 27% advance in 2008 in the midst of the financial crisis have been greater in percentage terms than our 25% advance. Our DNA doesn’t match these two at all. The only conclusion we can draw is that we have a 1st leg up in a new bull market and not a bear market rally.
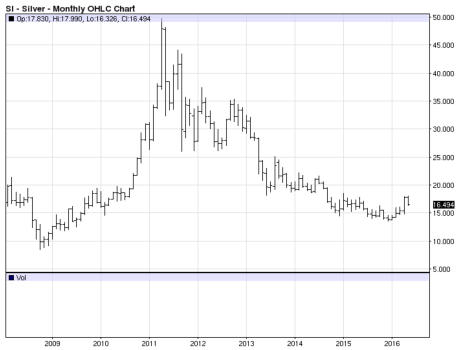
Silver hit record demand in 2015, but had its third successive annual deficit, which was 60% larger than 2014. These were just a few of the findings of this year’s report. However, the report is backward looking and the silver market is much different today than it was towards the end of last year. Erica Rannestad, precious metals demand senior analyst for Thomson Reuters GFMS, agreed in that interest for silver has shifted, which is helping to support prices this year. “First off, in the past 2-3 years, you’ve seen bargain buying. This year, you’ve seen a lot more safe-haven buying, which has been pushing prices higher,” she explained.
Oil
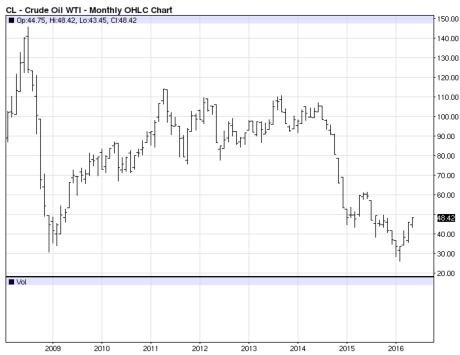
There are a lot of tankers sitting off the coast of Singapore waiting for a price increase and refinery availability to dump their cargo (http://www.zerohedge.com/news/2016-05-20/something-stunning-taking-place-coast-singapore ). South American suppliers are trying to sell every drop to have available funds to ensure the population is fed, staving off utter collapse and revolution. India is even trading drugs for oil now. Middle Eastern suppliers are holding supply steady in an attempt to make enough money to support their lifestyles and basic requirements. International refineries are working as fast as they can to turn over supply in hopes of being able to pay their bills. All of this will have a short term cap on prices.
Longer term, as players go bankrupt and governments are overthrown, then supply will be limited into a market of relatively stable world demand. This will drive prices higher, but it is a couple of years away, at least.
In the short term, expect that every approach of WTI Crude Oil near the 50 level will be sold off.


Comments»
No comments yet — be the first.