10212014 October 21, 2014
Posted by easterntiger in economy, financial, markets, silver, stocks.Tags: bonds, Economic Cycles, economic theory, f fund, Federal Open Market Operations, Financial Trends, interest rates, momentum indicator, silver, stock market, stock market index
trackback
Weather Report Update 10212014
Current Positions (CHANGES) I(Intl) – 10%; S(Small Cap) – up to 10%; C(S&P) –up to 25%
F(bonds) – no change; G (money market) – remainder
Weekly Momentum Indicator (WMI) last 4 weeks, thru 10/17/14
(S&P100 compared to exactly 3 weeks before***)
-31.9, -42.66, -2.82, -5.09
(Yesterday from 3 Fridays ago/2 Fri’s fm 4 Friday’s ago/3 Fri’s fm 5 Friday’s ago/4 Fri’s fm 6 Friday’s ago)
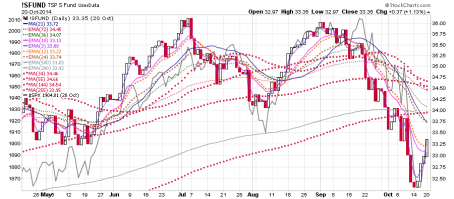
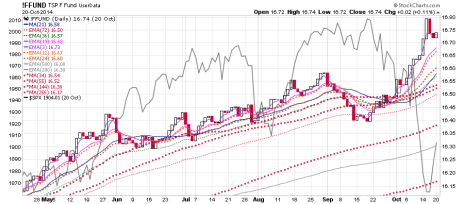
The partial exit from the F fund last week was warranted, as interest rates hit an ‘exhaustion’ low before rebounding. This offered the opportunity to hold on to F fund profits at or near the highest prices of the year. (top to bottom C fund, S fund, I fund, & F fund, since May, with S&P 500 superimposed in thick gray background; maps to C fund)
Now that the indexes are back from just above or below zero for the year, there is every incentive to raise them back to between 3-8% before the end of the year. This will coincide with optimism leading into the Fed meeting at the end of the month, seasonal strength approaching Thanksgiving, the shopping season, etc., also known as the ‘Santa rally’, the usual medicine to raise the consumer mood to encourage spending during the season. 69% of the economy is driven by consumer spending. The historical record of strength into the end of the year is somewhat reliable, particularly after a weak September and October. A partial entry into equity funds, near some of the lowest levels of the year, is a safe way to participate in the year end support, while still considering the risks surrounding the October 29th Fed meeting. A final ‘signal’ won’t occur until after that meeting. This exhausts our two intra-fund moves for the month, unfortunately. For safety, an emergency exit to G is still allowed. We’ll know whether or not to reduce or to increase these positions early in November.
The ‘depth readings’ are similar to those after the February decline, about a 6% loss, after which levels retraced over the next two months about 7%, most of which occurred in about 4 weeks.
Last week, the I fund fell to it’s lowest levels of the year, -7.45% year to date. The S fund fell as low as -3.65% year to date, only 1.25% over it’s low established in February. The C fund stayed on the plus side by just over 2% year to date, setting it’s lows for the year earlier in the year at -5.66% year to date in February and -1.17% year to date in April. In essence, the S&P 500 was riskier early in the year, while the small caps and international funds have become riskier as the year has progressed. So much for the idea that we can treat all categories of equities as having equal opportunities or equal risks. The opportunities and risks vary and cannot be ‘sensed’ by occasionally checking price levels, or, casually observing your personal account statements, after the fact, several times a year. Meanwhile, the F fund found it’s highs for the year last week, near 7% year to date, as the ‘flight to quality’ in bonds absorbed the same capital that shifted from equities of all categories. After a brief pause between now and year end, this is expected to resume in the 1st quarter.
Positive
- Weekly indicators flattened this week, showing short-term support.
- Sales/purchase ratio by insiders dropped from over 50:1 down to 16:1, reflecting a slightly stronger, but, still negatively-biased intention to increase near-term buying, or, to decrease levels of near-term selling
- New Highs over New Lows reached a 2-month high last Thursday and Friday.
- The ‘fear’ or volatility indexes reached their highs in 3 years last week. These highs frequently represent short-term market bottoms.
- The S&P100 has not been this far below the 40-week moving average since November 2012, a previous buy point, rising 7% by that year’s end.
Negative
- As large as recent rebounds appear, we are still down lower than levels of Friday, October 10th, except on the S fund, where upward momentum is also slowing first.
- Numerous support zones were broken in the past two weeks and must now be treated as resistance over the next few weeks.
- ‘Smart money’ still has some positioning as if they expect future declines, with heavy hedging toward downside expectations over the next few months.
- The level of buy signals on individual stocks are among the lowest levels of the year
- April lows were broken on the Russell 3000; August lows were broken on the S&P 500 and NASDAQ 100
- A 1300 point drop in the Dow Jones Industrials avearge in less than two months has not occurred since July/August 2011, near the end of the traditional weak season occurring this far from a market bottom, as in March 2009, carries significantly more weight, projecting a greater likelihood of weakness beyond any near-term ‘bounce’. The last time before that was at the 2007 market top.
Short-term, sixteen key industries have an average potential upside of 10%, based upon measuring against the current lower levels against both recent highs and their 50-day averages. These industries include oil services, pharmaceuticals, networking, airlines, semiconductors, disk drive manufacturers, transportation, computer hardware, banks, broker/dealers, retail, biotech, real estate investment trusts and insurance.
The oversold condition of the silver market ranks 5th in history in terms of the time to reach this point (3 years, 5 months, 8 days), and, 4th in history in terms of the percentage decline (66% from the most recent high). These traits strongly suggest that only a low probability exists for a further concern for lower prices. Statistically and historically, this should be seen as a prime buying point with regard to the likelihood for appreciation on any current purchases.


Comments»
No comments yet — be the first.